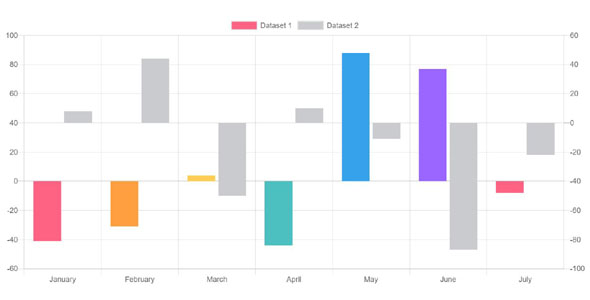
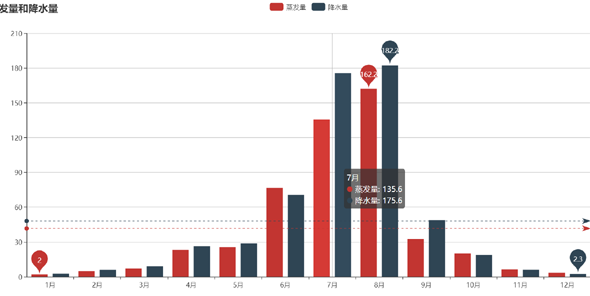
echarts.js统计图表插件的例子,统计某地区蒸发量和降水量柱状图表
js统计某地区蒸发量和降水量柱状图表
正在加载文件目录...
- 热度 28
![](https://imgs.bootstrapmb.com/2021/12/141020118.jpg)
Marshmello下载了 此素材
![](https://imgs.bootstrapmb.com/2023/3/231141449.jpg)
戰赱殤あ磊下载了 此素材
![](https://imgs.bootstrapmb.com/2022/9/210825442.jpg)
张玉峰下载了 此素材
![](https://imgs.bootstrapmb.com/2022/10/260509319.jpg)
Simon下载了 此素材
![](https://imgs.bootstrapmb.com/2023/6/181042059.jpg)
-黄泰山下载了 此素材
![](https://imgs.bootstrapmb.com/2023/8/060206115.jpg)
M.下载了 此素材
![](https://imgs.bootstrapmb.com/2021/1/050314471.jpg)
用户7516761809下载了 此素材
![](https://imgs.bootstrapmb.com/2021/8/271047143.jpg)
酸奶下载了 此素材
![](https://imgs.bootstrapmb.com/2022/4/270454120.jpg)
离谱.下载了 此素材
![](https://imgs.bootstrapmb.com/2022/10/081129361.jpg)
左心房下载了 此素材